

Glycemic Load Breakfast Calculation Guide
The formula is simple: GL = (GI × grams of available carbohydrate) ÷ 100. Take one slice of white bread: GI of 75, about 12 grams of available carbohydrate, so GL = (75 × 12) ÷ 100 = 9. That single number tells you how much that slice will actually move your blood sugar, portion and all. According to the University of Illinois Extension, this GL value falls in the low range, meaning that one slice, on its own, is a gentler choice than most people assume.
That is the whole method. Everything below is just practice.
Table of Contents
- Why glycemic load tells you more than glycemic index does
- How to calculate glycemic load for a single breakfast food
- Worked examples for common breakfast foods
- What low, medium, and high GL values mean at the breakfast table
- What the research says about low-glycemic sweeteners at breakfast
- Key Takeaways
- The table is the point
- A sweeter morning, without the spike
- Useful sources and further reading
Why glycemic load tells you more than glycemic index does
Glycemic index (GI) ranks how fast a carbohydrate food raises blood sugar on a scale of 0–100, using pure glucose as the benchmark. Glycemic load (GL) takes that ranking and multiplies it by the actual grams of carbohydrate you eat, then divides by 100. The result reflects both the quality and the quantity of carbs in a serving, which is why Harvard Health and the Linus Pauling Institute both describe GL as the more practical tool for real-world meal planning.
Watermelon is the classic example. Its GI is high (around 72), which sounds alarming. But a standard cup of diced watermelon has only about 11 grams of available carbohydrate, so its GL lands at 8, firmly in the low range. GI alone would have you skipping it at brunch. GL tells you it is fine.
A few honest limits to keep in mind:
- GI values are measured under controlled lab conditions and represent population averages. Your personal blood sugar response will vary based on gut microbiome, stress, sleep, and what else is on the plate.
- Cooking method, ripeness, and food processing all shift GI. A ripe banana has a higher GI than an underripe one; pasta cooked al dente has a lower GI than soft-cooked pasta.
- GL is a planning tool, not a clinical prescription. If you need precise glucose management, pair these calculations with guidance from your healthcare provider.
For a deeper look at how carbohydrates rank on glycemic index, the Yakonow blog has a clear breakdown worth bookmarking alongside this guide.
How to calculate glycemic load for a single breakfast food
The math takes about 30 seconds once you have two numbers in hand: the food’s GI and its available carbohydrate per serving.
-
Find the GI value. The University of Sydney’s GI database is the gold standard. The UGA Extension tables and the Linus Pauling Institute’s food charts are reliable backups. When a specific food isn’t listed, use the closest analog (steel-cut oats instead of a generic “oatmeal” entry, for example) and note the substitution.
-
Calculate available carbohydrate. Read the nutrition label: take Total Carbohydrate and subtract Dietary Fiber. That remainder is the available carbohydrate, the fraction that actually raises blood glucose. As dummies.com’s GL guide explains, skipping this subtraction overstates GL, especially for high-fiber whole foods like oat bran or lentils.
-
Apply the formula. GL = (GI × available carbs in grams) ÷ 100. Round to the nearest whole number.
-
Check your serving size. GL scales directly with portion. Double the serving, double the GL. This is where a kitchen scale earns its place on the counter.
Pro Tip: If you don’t have a scale, use these rough conversions: 1 cup of dry oats ≈ 80 g; 1 medium banana ≈ 118 g; 1 slice sandwich bread ≈ 30 g. These get you close enough for planning purposes.
When GI data is genuinely unavailable (a specialty granola, a homemade muffin), use the GI of the most similar commercial product and flag it as an estimate. Manufacturer websites sometimes publish GI data for branded products; it’s worth a quick search before defaulting to a generic value.
Worked examples for common breakfast foods
The table below uses GI values drawn from the UGA Extension glycemic index tables and the dummies GL calculation guide. Available carbohydrate = total carbs minus fiber per the serving listed.
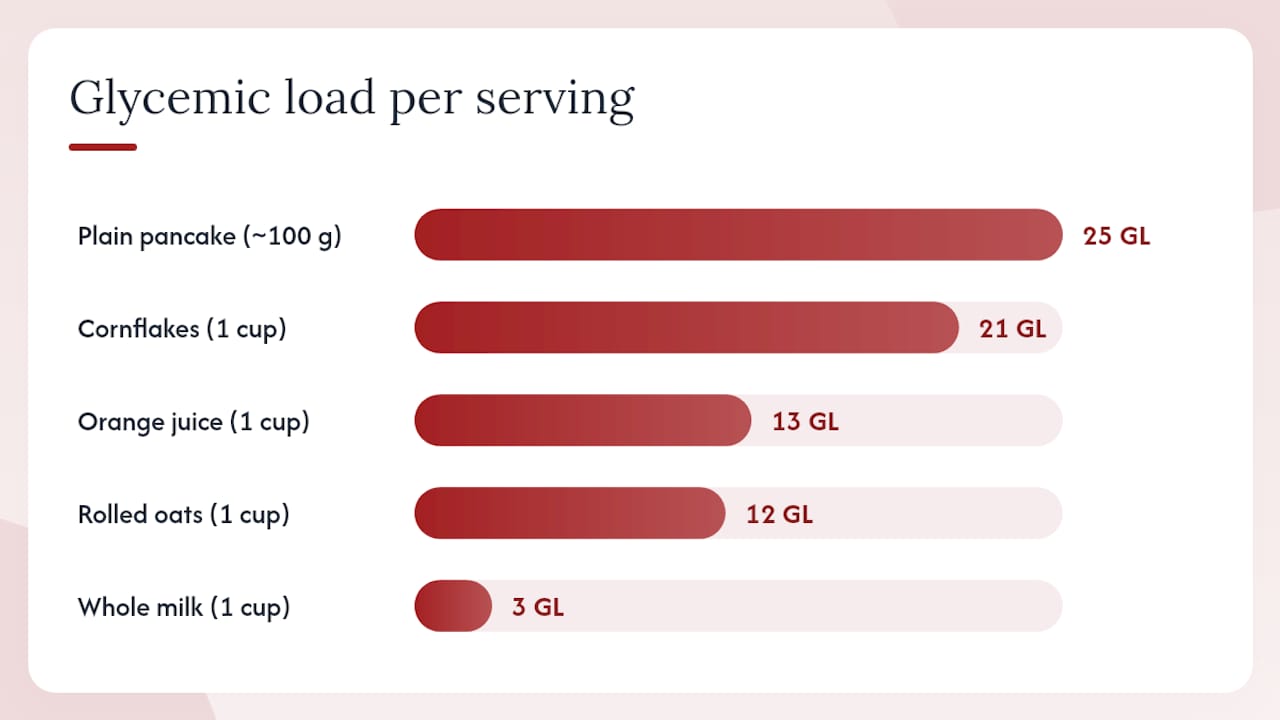
| Breakfast food | GI used | Available carbs per serving (g) | Calculated GL per serving | Meal contribution |
|---|---|---|---|---|
| White bread (1 slice, 30 g) | 75 | 12 | 9 | Low on its own; stacks fast with jam |
| Whole wheat bread (1 slice, 30 g) | 69 | 11 | 8 | Slightly lower; fiber helps |
| Rolled oats, cooked (1 cup) | 55 | 21 | 12 | Medium; add protein to keep it there |
| Cornflakes (1 cup, 30 g) | 81 | 26 | 21 | High; one of the worst cereal choices |
| Plain pancake (two 4-inch, ~100 g) | 55 | 26 | 25 | High; toppings matter enormously |
| Banana, medium (118 g) | 51 | 23 | 12 | Medium; riper = higher GI. |
| Whole milk (1 cup) | 27 | 12 | 3 | Low; protein and fat slow absorption |
| Orange juice (1 cup) | 50 | 26 | 13 | Medium; whole fruit is a better swap |
| Eggs, 2 large | ~0 | ~0 | 0 | Adds protein with zero GL impact |
| Blueberries (1 cup) | 54 | 18 | 9 | Low; one of the best fruit choices |
Two fully worked examples:
Rolled oats: GI = 55, available carbs = 21 g. GL = (55 × 21) ÷ 100 = 12, which falls in the medium range.
Cornflakes: GI = 81, available carbs = 26 g. GL = (81 × 26) ÷ 100 = 21, which is in the high range before you add milk or sugar.
Eggs deserve a special note. According to glycemic-index.net’s egg data, two large eggs contain roughly 0.4 grams of available carbohydrate total. The resulting GL is effectively zero. Any breakfast anchored by eggs starts from a clean slate, which is why they pair so well with higher-GL foods like toast or fruit.
What low, medium, and high GL values mean at the breakfast table
The University of Illinois Extension sets the standard thresholds:
- Low GL: ≤ 10 per serving
- Medium GL: 11–19 per serving
- High GL: ≥ 20 per serving
A practical target: Many nutrition guides suggest keeping a single meal’s total GL in the low-to-medium range, roughly 10–20 GL units, to avoid a sharp glucose spike. A full day’s GL below a certain moderate threshold is often cited as a reasonable goal for most adults.
What does each range look like on an actual breakfast plate?
A low-GL breakfast might be two scrambled eggs, a cup of blueberries, and a cup of whole milk. Total GL: roughly 12. Gentle, satisfying, and easy to hold together with a few pantry staples.
A medium-GL breakfast looks like a bowl of steel-cut oats with a small banana and a splash of milk. Total GL: around 18–22 depending on portions. Still manageable, especially when protein and fat are present to slow digestion.
A high-GL breakfast is a bowl of cornflakes with skim milk and a glass of orange juice. Total GL: over 34. That combination hits fast and tends to leave people hungry again by mid-morning.
These ranges guide planning rather than dictate it. The goal is to notice patterns, not to count every gram at every meal.
What the research says about low-glycemic sweeteners at breakfast
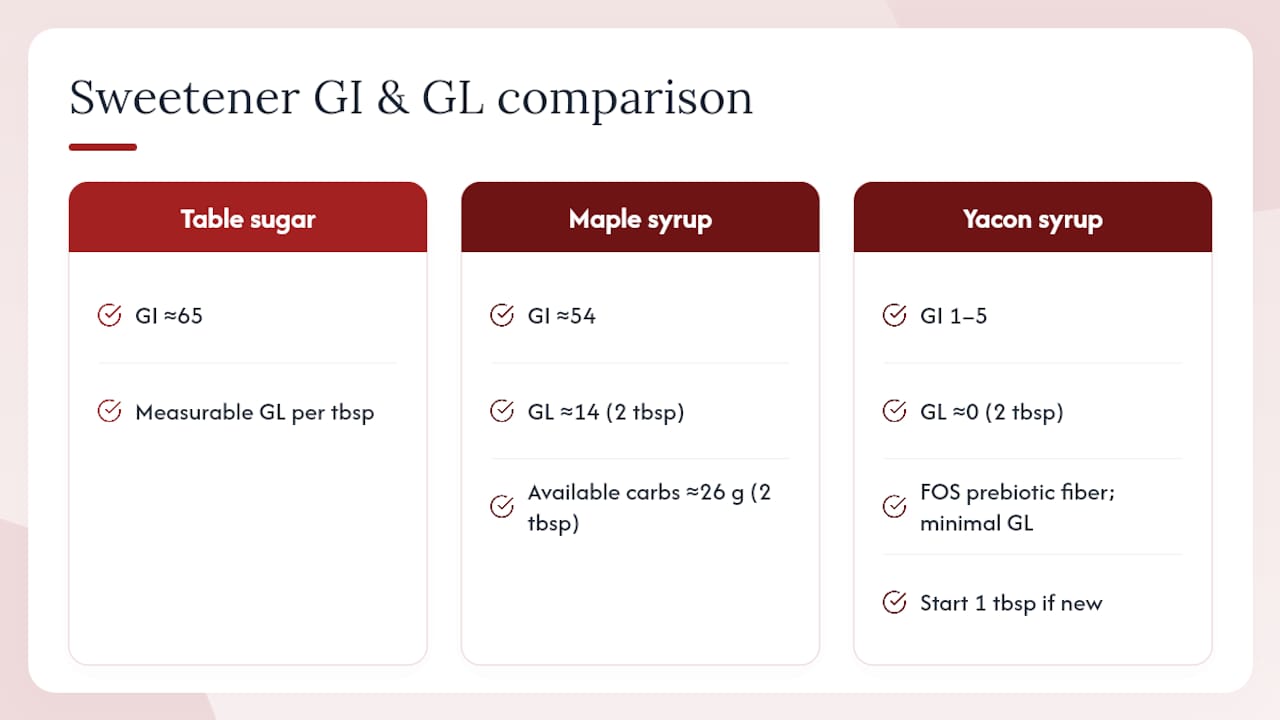
The sweetener on top of your pancakes or stirred into your oatmeal is often the easiest GL lever to pull. Table sugar has a GI of around 65. Maple syrup sits near 54. Both add measurable GL at the tablespoon level.
Yacon syrup occupies a different category. Its GI is typically reported in the range of 1–5, primarily because its sweetness comes from fructooligosaccharides (FOS), a prebiotic fiber that the small intestine cannot digest. As Diabetesnet’s practical GL guide notes, very-low-GI sweeteners contribute minimal GL when used in typical amounts, making them a meaningful swap for anyone managing meal GL at breakfast.
Worked substitution: Two tablespoons of maple syrup (GI ≈ 54, available carbs ≈ 26 g) adds a GL of about 14 to a meal. Two tablespoons of yacon syrup (GI ≈ 1, available carbs from FOS behave as fiber) adds a GL close to zero. The drizzle stays. The glucose spike from the syrup, largely, does not.
A note on starting amounts: Yacon syrup’s FOS fiber is gentle for most people, but if you’re new to it, starting with one tablespoon and building from there gives your gut time to adjust. The flavor is naturally sweet with a light molasses note, which works well on pancakes, waffles, and oatmeal without overpowering the dish.
For a detailed look at how yacon syrup compares to maple syrup across sugar content, GI, and flavor, the yacon syrup vs. maple syrup comparison on the Yakonow blog lays it out clearly. And if you want to understand the prebiotic fiber side of the equation, the yacon syrup benefits guide covers what FOS actually does once it reaches your gut.
This article is general nutrition information, not medical advice. If you are managing diabetes or a related condition, confirm any dietary changes with your healthcare provider.
Key Takeaways
Breakfast GL is the sum of each food’s individual GL, calculated as (GI × available carbs in grams) ÷ 100, and keeping that total in the low-to-medium range (roughly 10–20 GL units) is the most practical morning target.
| Point | Details |
|---|---|
| The core formula | GL = (GI × available carbs in grams) ÷ 100; available carbs = total carbs minus fiber. |
| GL thresholds | Low ≤ 10, Medium 11–19, High ≥ 20 per serving; aim for a meal total of roughly 10–20 GL units. |
| Eggs anchor a low-GL plate | Two large eggs contribute approximately 0 GL, making them the easiest high-protein base for any breakfast. |
| Portion size is the fastest lever | Halving a serving halves the GL; doubling it doubles the number, regardless of GI. |
| Yakonow yacon syrup | With a GI of approximately 1–5, it adds near-zero GL to pancakes, oatmeal, or waffles as a direct swap for maple syrup. |
The table is the point
There is something worth saying about what happens when you actually sit down with this formula at a Saturday morning table. You are not running a clinical trial. You are making pancakes.
The GL calculation is most useful not as a daily accounting exercise but as a one-time education. You run the numbers on your usual breakfast a few times, you notice that the cornflakes are doing more work than the banana, and then you make one or two quiet swaps. Steel-cut oats instead of instant. Blueberries instead of juice. A different syrup. And then you stop calculating and just eat, because you have already internalized what a reasonable plate looks like.
That is the real value of a glycemic load breakfast calculation guide: it gives you a mental model, not a spreadsheet to maintain forever. The families who use it well are the ones who learn it once, adjust a few habits, and then get back to the actual point of breakfast, which is gathering everyone at the table before the day pulls them apart.
Try the swap on a weekend morning. See how the numbers shift. Then put the calculator away and pass the syrup.
A sweeter morning, without the spike

Yakonow yacon syrup is single-ingredient, hand-harvested in Peru, and bottled in Texas. Its GI of approximately 1 means that two tablespoons over a stack of pancakes add near-zero GL to your morning plate, while the prebiotic FOS fiber feeds the good bacteria in your gut. No artificial sweeteners, no added sugar, no colorants. Just a naturally sweet drizzle that lets the ritual stay exactly as it should be.
For a family that makes pancakes on Saturday mornings, the swap is invisible to the kids and meaningful to you. Drizzle it over waffles, stir it into oatmeal, or spoon it over yogurt and fresh fruit. The flavor is warm and lightly caramel, closer to a mild molasses than a sharp sweetness.
Start with the single 6oz bottle to try it at your table. Families who go through it quickly tend to move to the pack of 2 or the pack of 4 so they never run out on a Sunday morning.
Useful sources and further reading
The sources below are the primary references for this guide. Each one is worth bookmarking if you plan to look up GI values for specific foods or dig deeper into the research.
- Glycemic Load and Glycemic Index
- Glycemic Index and Glycemic Load | Linus Pauling Institute
- Glycemic index and glycemic load (UGA Field Report)
- Egg: Glycemic Index (GI), Glycemic Load (GL) and Nutrition Facts
- Glycemic Index & Glycemic Load: Practical Guide 2026 - Diabetesnet.com
- How to Calculate Glycemic Load | dummies
- The lowdown on glycemic index and glycemic load
To look up a specific food’s GI, the University of Sydney’s searchable GI database (glycemicindex.com) is the most comprehensive resource available and is updated regularly with new research.